Plot Metrics for Generalized Linear Mixed Models (GLMM)
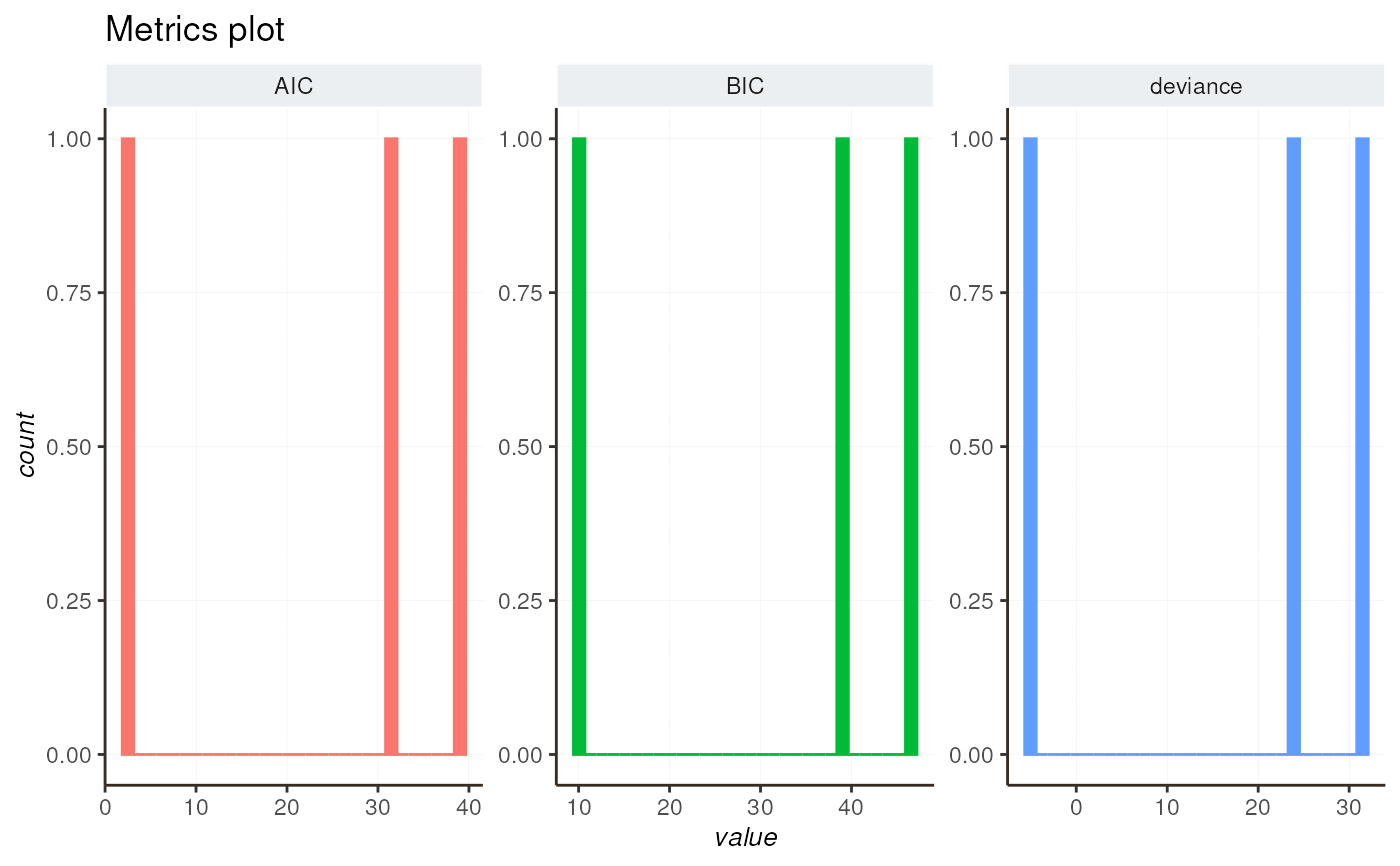
diagnostic_plot.RdThis function generates a density plot of the specified metrics for the given list of generalized linear mixed models (GLMMs).
Arguments
- list_tmb
A list of GLMM objects to extract metrics from.
- focus
A character vector specifying the metrics to focus on. Possible values include "AIC", "BIC", "logLik", "deviance", "df.resid", and "dispersion". If
NULL, all available metrics will be plotted.
Examples
models_list <-  fitModelParallel(Sepal.Length ~ Sepal.Width + Petal.Length,
                     group_by = "Species",n.cores = 1, data = iris)
#> Log file location: /tmp/RtmpS86cq0/htrfit.log
#> CPU(s) number : 1
#> Cluster type : PSOCK
diagnostic_plot(models_list, focus = c("AIC", "BIC", "deviance"))
#> Using group_id as id variables
#> `stat_bin()` using `bins = 30`. Pick better value with `binwidth`.
