Benchmarking HTRfit and DESeq2
04-htrfit_vs_deseq2.RmdHTRfit offers a wrapper for DESeq2 outputs. This functionality allows users to seamlessly integrate the results obtained from DESeq2 into the HTRfit evaluation pipeline. By doing so, you can readily compare the performance of HTRfit with DESeq2 on your RNA-seq data. This comparative analysis aids in determining which tool performs better for your specific research goals and dataset
Simulation
The choice of input parameters plays a critical role in the simulation process. For optimal results, we recommend basing these decisions on real data, as outlined in the Simulation tutorial
## -- init a design
list_var <- init_variable( name = "genotype", sd = 0.2462256, level = 2) %>%
            init_variable( name = "environment", sd = 0.2462256, level = 4) %>%
            add_interaction( between_var = c("genotype", "environment"), sd = 0.2462256)


N_GENES <- 100
MIN_REPLICATES <- 4
MAX_REPLICATES <- 4
SEQ_DEPTH <- 5e6

## -- simulate RNA-seq data
mock_data <- mock_rnaseq(list_var,
                         n_genes = N_GENES,
                         min_replicates  = MIN_REPLICATES,
                         max_replicates = MAX_REPLICATES,
                         basal_expression = 2,
                         sequencing_depth = SEQ_DEPTH)
Fit models
## -- data from simulation
count_matrix <- mock_data$counts
metaData <- mock_data$metadata
HTRfit
## -- convert counts matrix and samples metadatas in a data frame for fitting
data2fit = prepareData2fit(countMatrix = count_matrix,
                           metadata =  metaData,
                           normalization = 'MRN',
                           response_name = "kij")

l_tmb <- fitModelParallel(
          formula = kij ~ genotype + environment  + genotype:environment,
          data = data2fit,
          group_by = "geneID",
          family = glmmTMB::nbinom2(link = "log"),
          n.cores = 1)
DESeq2
## -- DESeq2
dds <- DESeq2::DESeqDataSetFromMatrix(
  countData = count_matrix,
  colData = metaData,
  design = ~ genotype + environment  + genotype:environment )
dds <- DESeq2::DESeq(dds, quiet = TRUE)
Evaluation
Using evaluation_report() function, we assess the
capability of DESeq2 and HTRfit to identify conditions exhibiting a 25%
change in expression. Based on the identity plot, ROC curve, and PR
curve, we observe similar results between the two methods.
## -- get simulation/fit evaluation
resSimu <- evaluation_report(list_tmb = l_tmb,
                             dds = dds,
                             mock_obj = mock_data,
                             coeff_threshold = log(1.25), ## 25% of expression change
                             alt_hypothesis = "greaterAbs")
## -- Model params
resSimu$identity$params
## -- dispersion
resSimu$identity$dispersion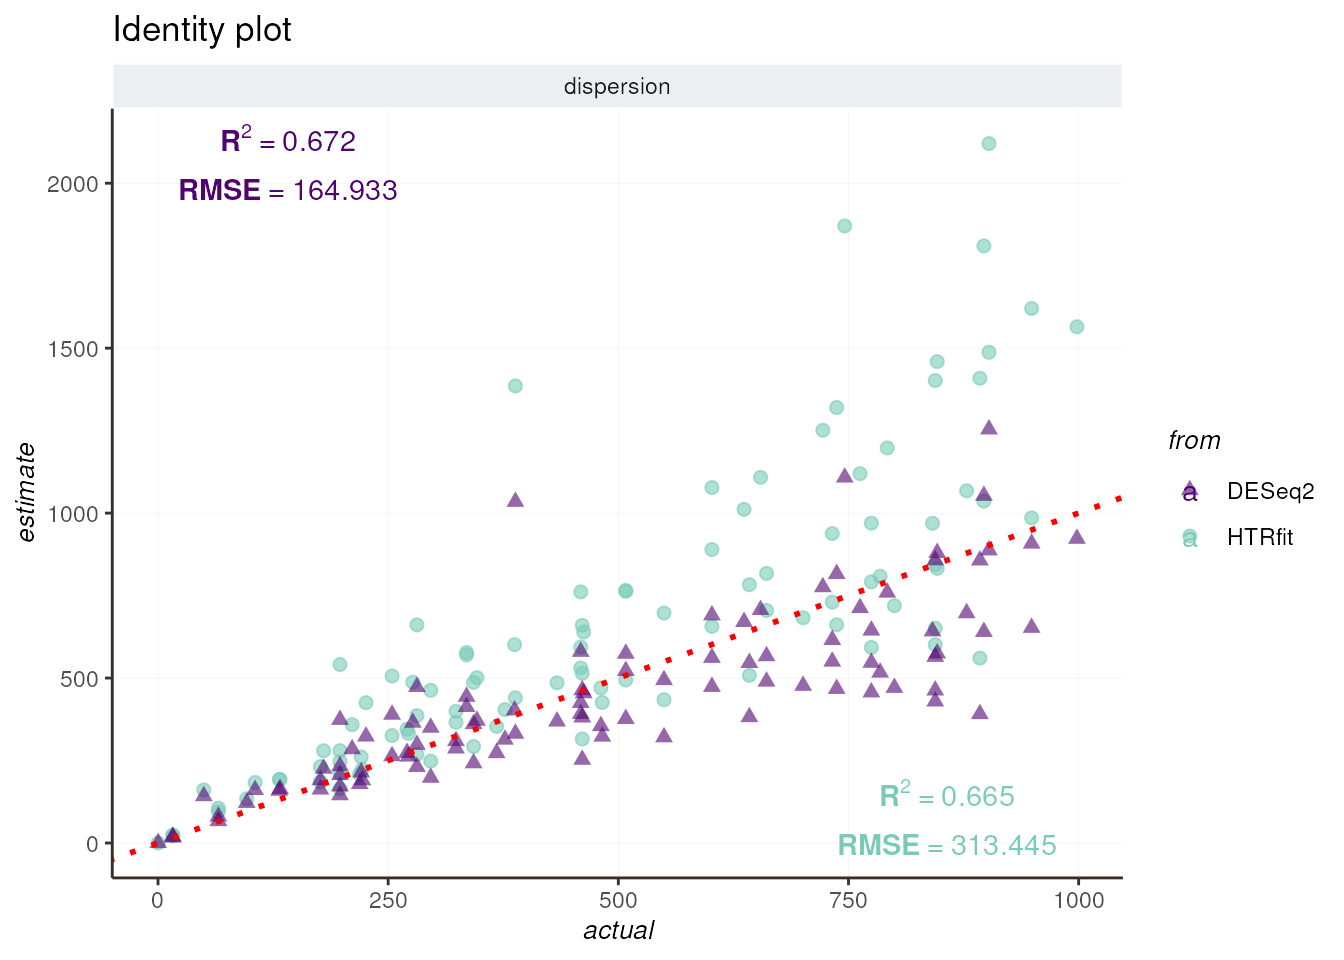
## -- precision-recall curve
resSimu$precision_recall$params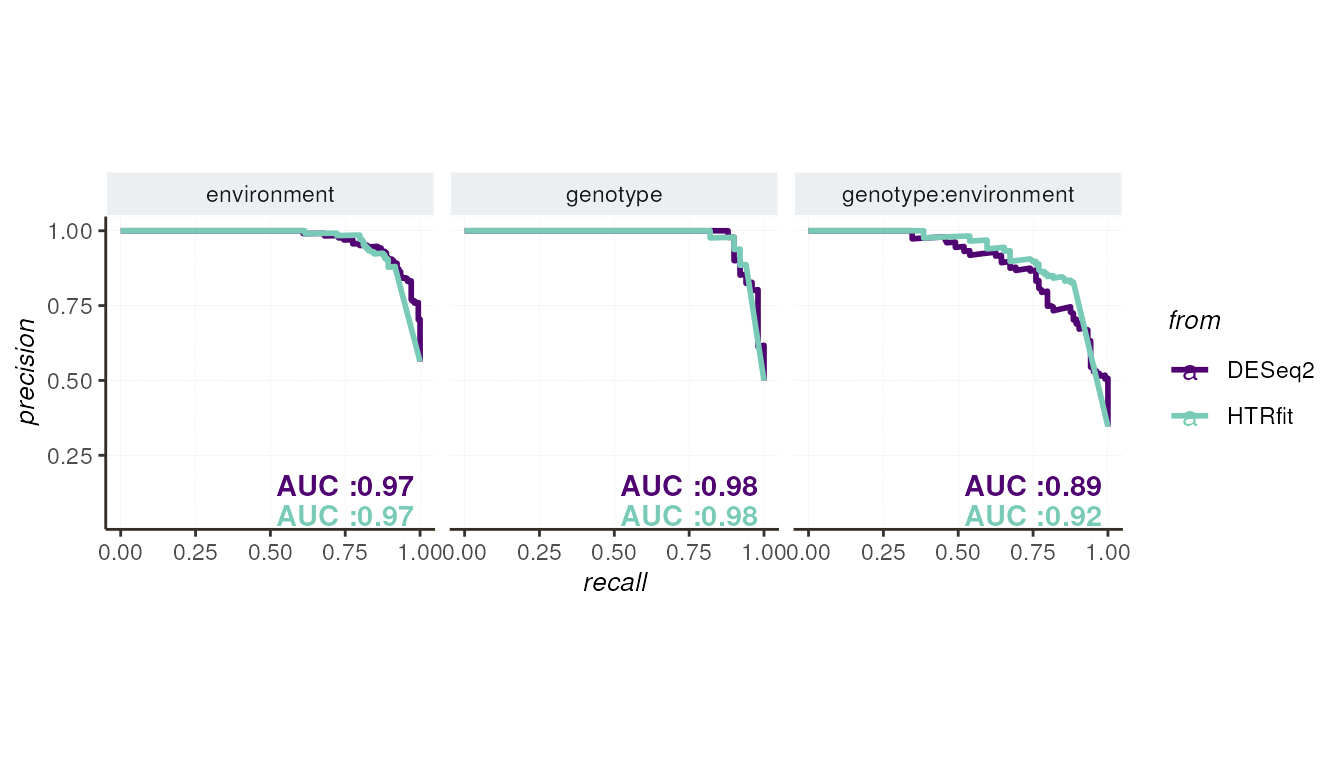
## -- ROC curve
resSimu$roc$params
Finally, we summarize the model’s performance of HTRfit and DESeq2 using various metrics, including R-squared (R²) and root mean square error (RMSE) for regression tasks, as well as area under the curve (AUC) for classification tasks.
## -- actual/estimate comparison
idx <- c(3,4,5,8,9,10)
resSimu$performances$byparams[idx, c('from', 'description', 'R2', 'RMSE')]| from | description | R2 | RMSE |
|---|---|---|---|
| DESeq2 | environment | 0.7663712 | 0.2120142 |
| DESeq2 | genotype | 0.9805118 | 0.0566179 |
| DESeq2 | genotype:environment | 0.7791885 | 0.1344705 |
| HTRfit | environment | 0.7663018 | 0.2120535 |
| HTRfit | genotype | 0.9804845 | 0.0566553 |
| HTRfit | genotype:environment | 0.7791163 | 0.1344988 |
## -- classification metrics
idx <- c(3,4,5,8,9,10)
resSimu$performances$byparams[idx, c('from', 'description', 'pr_AUC',
                                     'pr_randm_AUC', 'pr_performance_ratio',
'roc_AUC', 'roc_randm_AUC')]| from | description | pr_AUC | pr_randm_AUC | pr_performance_ratio | roc_AUC | roc_randm_AUC |
|---|---|---|---|---|---|---|
| DESeq2 | environment | 0.9730370 | 0.5633333 | 1.727285 | 0.9628484 | 0.5 |
| DESeq2 | genotype | 0.9794961 | 0.5000000 | 1.958992 | 0.9732000 | 0.5 |
| DESeq2 | genotype:environment | 0.8945609 | 0.3466667 | 2.580464 | 0.9311960 | 0.5 |
| HTRfit | environment | 0.9654006 | 0.5633333 | 1.713729 | 0.9382538 | 0.5 |
| HTRfit | genotype | 0.9762610 | 0.5000000 | 1.952522 | 0.9612000 | 0.5 |
| HTRfit | genotype:environment | 0.9153040 | 0.3466667 | 2.640300 | 0.9203051 | 0.5 |