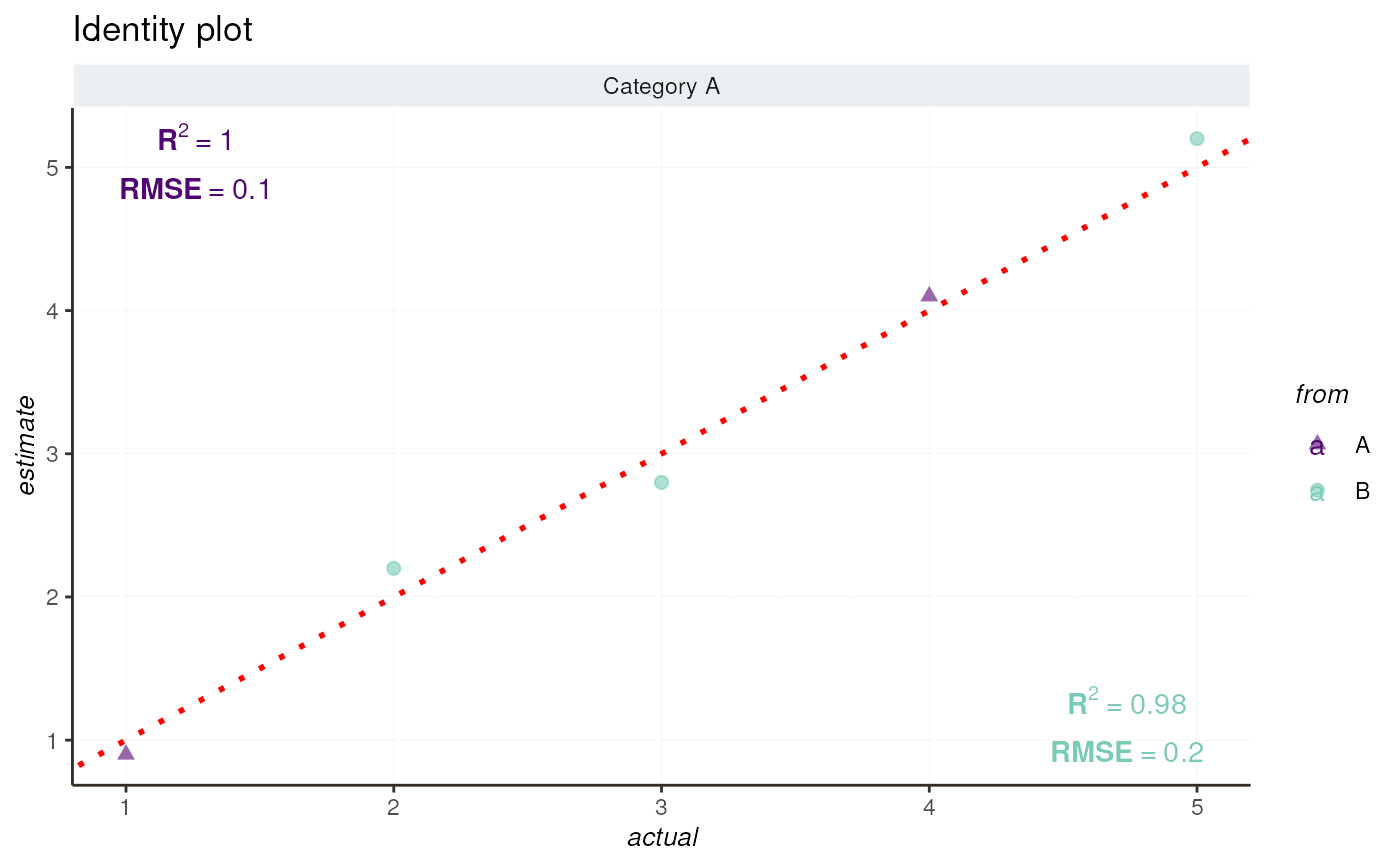
Generate an identity term plot and get metrics associated
eval_identityTerm.RdThis function generates an identity plot for comparing actual values with estimates
Arguments
- data_identity
A data frame containing comparison results with "actual" and "estimate" columns.
- palette_color
dict-like palette default: palette_color = c(DESeq2 = "#500472", HTRfit ="#79cbb8")
- palette_shape
Optional parameter that sets the point shape for plots.Default : c(DESeq2 = 17, HTRfit = 19).
- ...
additional parameters to pass geom_point aes
Examples
comparison_data <- data.frame(
       actual = c(1, 2, 3, 4, 5),
       estimate = c(0.9, 2.2, 2.8, 4.1, 5.2),
       description = rep("Category A", 5),
       term = rep("Category A", 5),
       from = c("A", "B", "B", "A", "B"))
eval_identityTerm(comparison_data,
                 palette_color = c(A = "#500472", B ="#79cbb8"),
                 palette_shape = c(A = 17, B = 19))
#> $R2
#>   from description        R2 RMSE
#> 1    A  Category A 1.0000000  0.1
#> 2    B  Category A 0.9795918  0.2
#>
#> $p

#>
#>